Purchase Price Variance Calculations
Feb 12, 2015
 The general reporting from cost systems in recent years has focused less and less on variance analysis and more so on product costing, product profitability and inventory valuation. I know some clients that monitor their variances by month and use that information to assist in management decisions. However, those businesses are generally in the minority, and although I believe that such information can be useful in the control of operations, fewer and fewer businesses are concentrating on developing those variance reports. However, one of the variances that are still widely used is a purchase price variance for materials.
It has been my experience that among those that do variance reporting, material variances are focused on more than labor and overhead variances. The two variances that are typically computed for material purchases and usage are the purchase price and raw material usage variance. It can be useful for management teams to see both. However, I see more and more businesses focusing just on the purchase price variance and using that to help control raw material costs.
I believe this shift has happened due to the fact that more of a product’s cost today is made up of raw material and less of labor and overhead. As a result, the attention of management is constantly being focused on to how to pay less for similar quality raw material that is necessary for their production activities. Due to this, purchase price variance is one of the surviving variances that is commonly used today.
Purchase price variance is usually captured at the time of purchase and is simply a comparison of the total units purchased times the standard cost compared to the total units purchased at the actual cost and that difference represents the purchase price variance. The usage of this variance is computed as the standard cost of actual units used compared to the standard cost of standard units that should have been used. The sum of those two represent the total variance associated with material usage and purchase price.
However, there’s an alternative method that I have only seen occasionally and it has to do with a different method of refocusing attention on the purchase price variance and the usage variance. The two methods are presented below:
Standard Price per Unit $1.00 Standard Usage per Unit 100 units Actual Price per Unit $1.10 Actual Usage per Unit 120 units
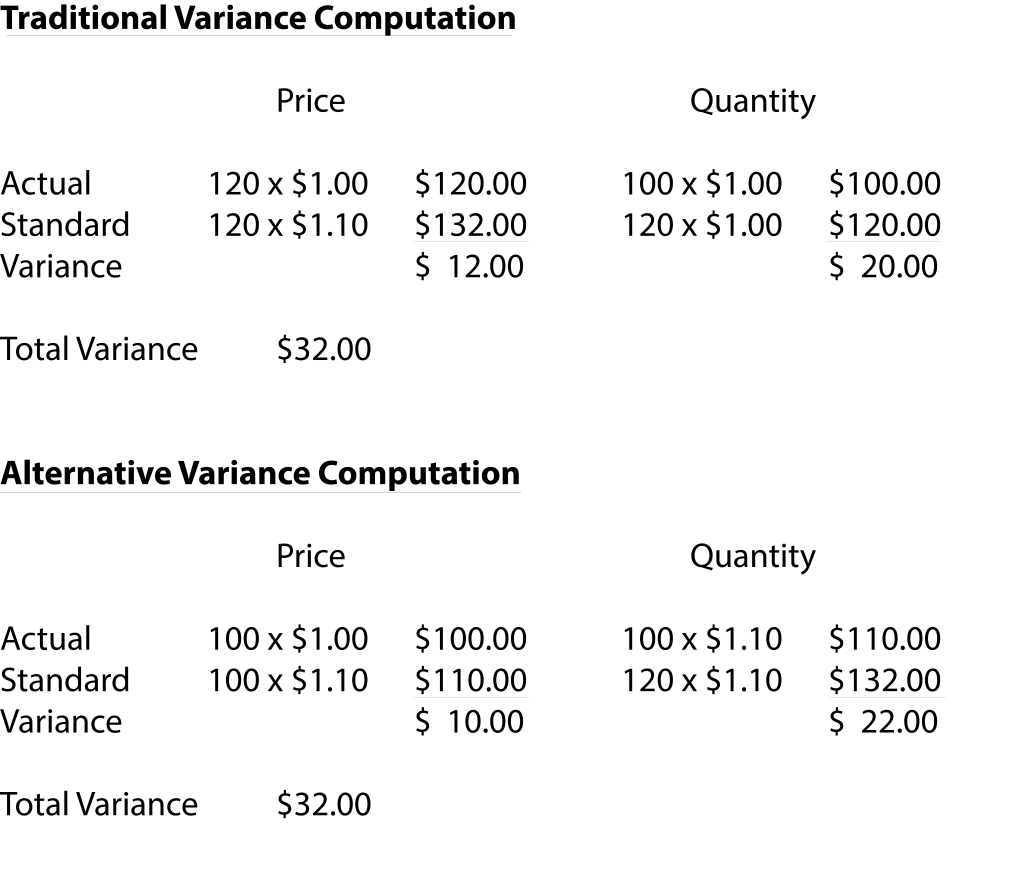
You can see the total variance is $32 no matter what method is used to compute the variance. However, the alternative computation attempts to show that the variance is due more to the fact that more units were used and less to the fact that the purchase price was greater. This highlights where the most “blame” can be placed. It is important to note, although that you need to make sure you are comparing apples to apples. If you have high inventory turnover and you are typically using materials you just purchased the alternative may be very meaningful to you. However, if your purchases and usage do not match up, it would not be as useful.
Categories: Cost Accounting