Least Squared Method: A Guide to Break-Even Points
Feb 20, 2014
Are you familiar with the Least Squared Method, or as some may call it, the Method of Least Squares. If so, it was probably in a statics class in college, or maybe it is a tool you frequently use. If not, simply put, it is a technique used to determine the line of best fit to data. The calculations are a dizzying series of calculus and algebraic formulas. Fortunately, Excel has a program to calculate the Least Squared Method. The thought of estimating true values and averaging out errors of increases an decreases actually was first expressed in 1722 by Roger Cotes, who was an English Mathematician, who worked closely with Sir Isaac Newton. As you can see this is not a new thought, but perhaps a new way of thinking…
One way we use the Least Squared Method is to compare a series of break-even points over time. Most recently, a client came to me saying they needed their break-even point down. Of course that leads to a discussion on how to do that. We talked about trying to limit spending as much as possible on some of the simple things like office supplies, or purchasing new office equipment, etc. We also talked about more difficult things like minimizing scrap, improving processes, etc. Many times owners find out that if they really watch and they push hard enough, especially in production, they can decrease their break-even point and hopefully get through and eventually flourish.
There will be months were the break-even point decreases dramatically and then months where it is higher than when you first started making efforts to decrease it. Although looking at the break-even point month-by-month is quite important, it may lose some meaning if you do not look at it using the Least Squared Method. You may feel quite discouraged when the break-even increases in a given month, but if you looked at it in whole, you would clearly see it has actually been a steady decrease. This statistical method is an easy tool that helps you see that. For example, the table below lists break-even points for January-July of any given year.
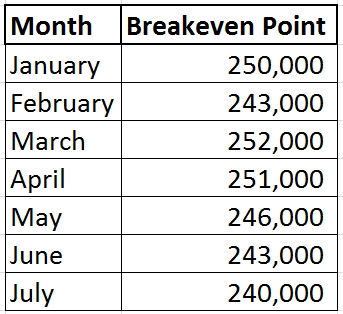
You can see in the table above that the break-even point fluctuates month-to-month, however, in the chart below you can see the Least Squared Method trend line shows that the overall trend is decreasing.

Without the simple use of this statistical tool you may end up frustrated looking at the numbers month-to-month thinking things are not improving the way you want and need them to, but from this chart you can see you are going in the right direction.
Categories: Cost Accounting